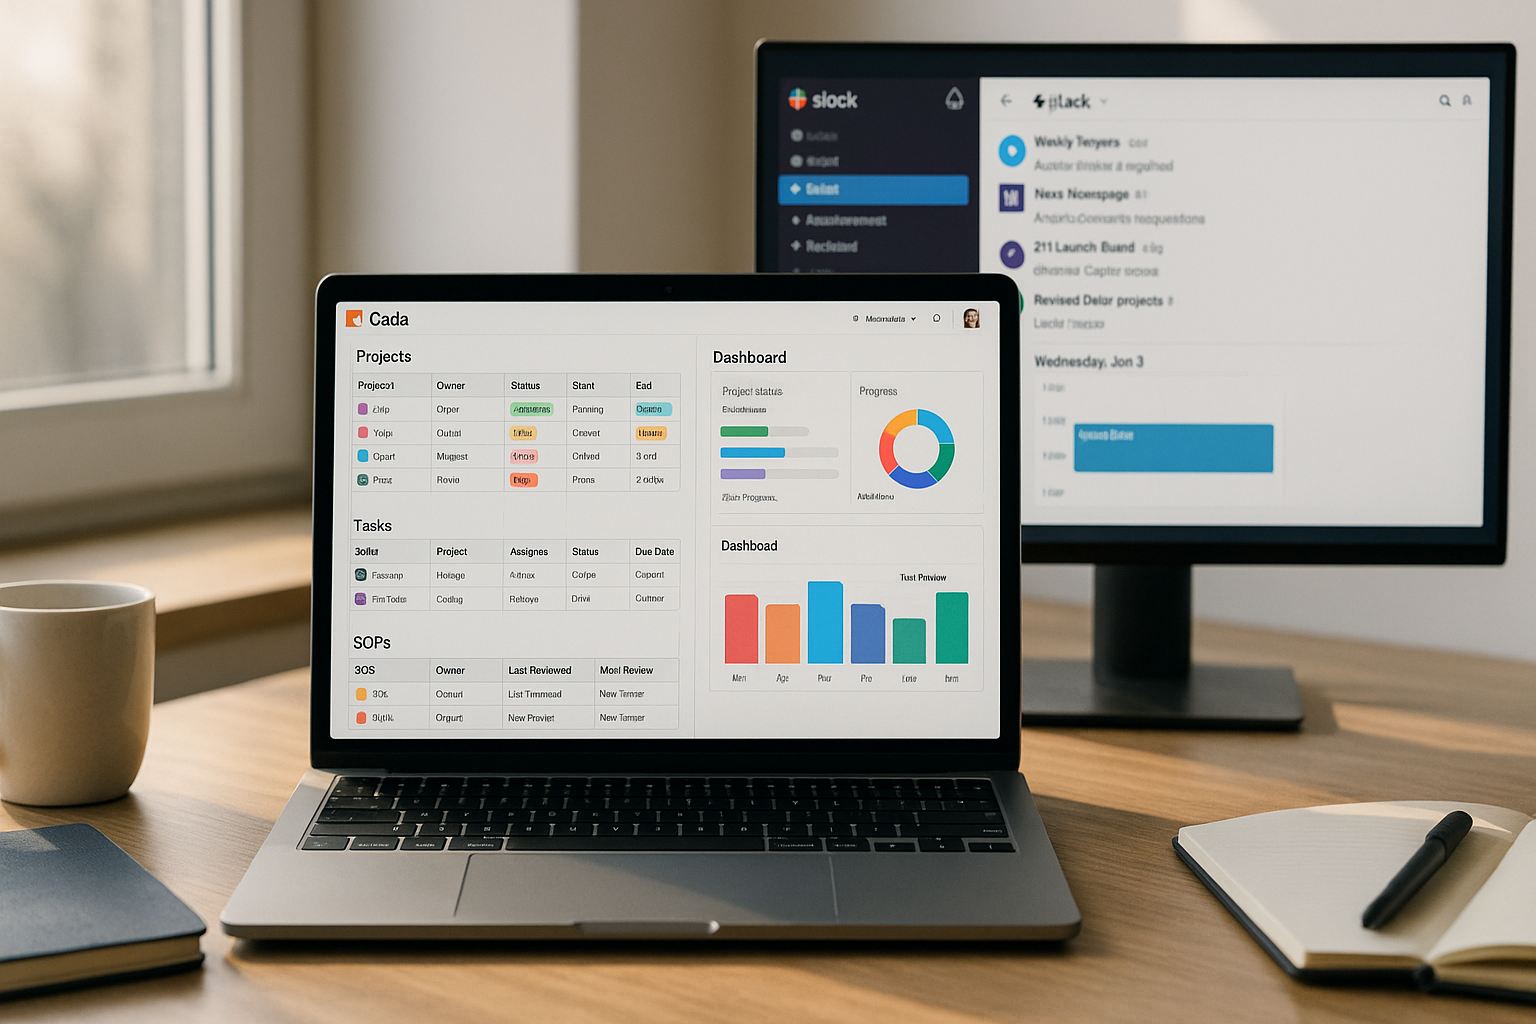
Most teams start with Google Docs for writing and Google Sheets for tracking. Over time, those files multiply, links break, and nobody is sure which spreadsheet is the source of truth. Coda solves this by merging a document’s flexibility with a database’s structure—plus buttons, automations, and integrations (Packs) that make your docs do work, not just store it. In this deep guide, you’ll build a production-ready “Team OS” in Coda for SOPs, projects, and metrics—complete with data modeling, views for each role, automations, and a 14-day rollout plan.
Why Coda (and where it beats docs & sheets)
- One surface for thinking and operating. You outline a plan on a page, but the tasks, owners, and dates live in tables that can be filtered, charted, and automated.
- Views, not copies. A single table can appear in multiple places (views) with different filters. Marketing sees just their tasks; leadership sees the whole portfolio—no duplicate spreadsheets.
- Buttons & automations. Push a button to create a templated project, assign owners, or send a Slack summary. Scheduled rules keep status and reminders flowing.
- Packs (integrations). Connect Slack, Gmail, Jira, GitHub, Google Calendar, HubSpot, and more so your doc becomes the workflow hub.
- Structured docs. Sections on the left act like wiki pages; Canvas blocks and callouts keep content skimmable.
If you love Notion’s knowledge pages but need Airtable-like tables, or you want Google Docs’ writing comfort with real workflow, Coda lands in the sweet spot.
The operating model you’ll build
We’ll create one Operating Manual doc with:
- Core Tables: Projects, Tasks, People, Processes (SOPs), Assets, and Metrics.
- Relations between tables using Lookup columns.
- Role-based Views so each team member sees exactly what matters.
- Buttons & Packs to spin up projects, post updates to Slack, and file tasks.
- Automations for reminders, status nudges, and weekly rollups.
- Templates for Project Briefs and SOPs.
- Dashboards for portfolio health and team workload.
You can start small (Projects + Tasks) and layer the rest in days.
Step 1 — Model your data (tables & relationships)
Create these tables (names in bold; key columns in italics):
- People
Name (Person), Role (Select), Manager (Lookup to People), Workload target (hrs/wk) (Number), Slack handle (Text). - Projects
Project (Text), Owner (Lookup → People), Status (Select: Planning, In progress, At risk, On hold, Done), Start, End (Dates), Tags (Multi-select), Health (Select: Green/Yellow/Red), Goal link (URL), Brief (Canvas column). - Tasks
Task (Text), Project (Lookup → Projects), Assignee (Lookup → People), Status (Select: To do, Doing, Review, Done), Due (Date), Effort (hrs) (Number), Priority (P1–P4), Notes (Text). - Processes (SOPs)
SOP (Text), Owner (Lookup → People), Last Reviewed (Date), Review cadence (months) (Number), Next review (Formula:AddMonths([Last Reviewed],[Review cadence])), Steps (Canvas). - Assets (optional; for brand or docs)
Asset (Text), Type (Logo, Template, Diagram, Legal), Owner (Lookup → People), Link (URL). - Metrics (optional; for weekly OKR-adjacent tracking)
Metric (Text), Owner, Period (Week/Month), Target (Number), Actual (Number), Variance (Formula), Notes.
Relationships to create
- Tasks → Projects (Lookup)
- Tasks → People (Assignee)
- Projects → People (Owner)
- SOPs → People (Owner)
These links let you build portfolio, per-person, and per-project views without duplicating data.
Step 2 — Make role-based views (the magic of Coda)
From each base table, create filtered Views for common contexts:
- My Tasks (view of Tasks)
- Filter:
Assignee = User()andStatus != Done - Sort:
Due ascending,Priority P1→P4 - Conditional format: due within 2 days → red highlight
- Filter:
- This Week’s Projects (view of Projects)
- Filter:
End in this weekorStatus in (In progress, At risk) - Group by
Ownerto see responsibility at a glance
- Filter:
- Team Workload (grouped view of Tasks)
- Group by
Assignee, show sum ofEffort (hrs), add a conditional bar vsWorkload target
- Group by
- SOPs due for review (view of Processes)
- Filter:
Next review <= Today() - Button column: “Send review ping”
- Filter:
- Portfolio Board (kanban view of Projects)
- Group by
Status, card showsOwner,End,Health
- Group by
Place these views in intuitive sections: “Home” (team dashboard), “My Work,” “Portfolio,” “SOPs,” and “Reports.”
Step 3 — Add buttons that actually do things
Buttons turn pages into control panels. Add a Buttons section with:
- New project from template
- Action:
AddRow(Projects, Project, [Input.Project name], Owner, [Input.Owner], Status, "Planning", Start, Today(), End, Today()+30, Tags, [Input.Tags]) - Secondary action:
RunActions(AddRows(Tasks, ...))to create child tasks (kickoff, brief, first milestone) with default effort and due offsets.
- Action:
- Create tasks for assignees
- Multi-select control for People and a text control for task name.
ForEach(SelectedPeople, AddRow(Tasks, Task, TaskName, Assignee, CurrentValue, Due, Today()+7, Status, "To do"))
- Multi-select control for People and a text control for task name.
- Post Slack summary (Slack Pack)
- Compose a message using a
Format()formula:"*Weekly Portfolio:* " + ToText([This Week’s Projects].Filter(Status="At risk").Project.BulletedList()) - Action:
Slack::PostMessage(Channel, Message)
- Compose a message using a
- Send review request (Gmail/Outlook Pack)
- From SOPs view, button in each row to email Owner with page link and “due this week” notice.
Tip: Pair buttons with Controls (Selects, Toggles, Date pickers) to parameterize actions (e.g., pick a week, pick a channel).
Step 4 — Wire automations (so the doc runs itself)
Open Automations and add rules:
- Overdue nudges (daily, 8:00)
- If
Tasks.Filter(Status!="Done" AND Due < Today()).Count() > 0 - Then email or Slack each
Assigneewith their overdue list (group by person to avoid spam).
- If
- SOP review reminders (weekly, Mon 9:00)
- For each row in SOPs where
Next review ≤ Today()+7→ send Slack DM toOwnerwith a smart link to the row.
- For each row in SOPs where
- Health auto-color (on change)
- When a Project’s
Endpasses and there areTasksnot Done, setHealth = Red. - When all tasks are Done and
End ≥ Today(), setHealth = Green.
- When a Project’s
- Digest (Fridays 16:00)
- Collate “Projects moved to Done,” “New SOPs,” and “At risk” into a single message → Slack #weekly-ops.
Automations keep status aligned without manual shepherding.
Step 5 — Design pages people actually read
Structure matters. Use:
- Hero blocks (big headings) and Callouts for summaries and warnings.
- Toggle lists for FAQs or long explanations.
- Canvas column inside Projects so each row contains its brief, risks, and decisions inside the table—perfect for one-page project records.
- Pinned links to key sections (“Start here,” “Project templates,” “Submit a request”).
- Icons & color sparingly (Green = on track, Yellow = caution, Red = risk).
A clean page reduces cognitive load and encourages updates.
Step 6 — Connect your stack with Packs
Install Packs that match your tools (you can add them later; start with one):
- Slack: Post summaries, send DMs for at-risk tasks, log decisions to a channel.
- Gmail/Outlook: Template “brief request,” “review due,” and “launch announcement” emails.
- Google Calendar: Create events for Project kickoffs directly from the Project row.
- Jira/GitHub: Show linked issues by epic or label inside the Project’s canvas; create tickets from tasks.
- HubSpot/Pipedrive: Mirror deal name and close date on Projects for revenue context.
- Google Drive: Create a folder per Project (button), store links in the row.
Each Pack adds columns (e.g., “Slack channel”), actions (post, create, update), and formulas you can use in buttons or automations.
Step 7 — Formulas you’ll reuse (copy/paste)
- Next review date
If([Last Reviewed].IsBlank(), Today()+30, AddMonths([Last Reviewed], [Review cadence (months)])) - Workload per person (table view)
In People:Tasks.Filter(Assignee=thisRow AND Status!="Done").Sum([Effort (hrs)]) - Over/under capacity
thisRow.[Workload target (hrs/wk)] - thisRow.[Workload (hrs)] - Project completion %
Tasks.Filter(Project=thisRow).Percent([Status]="Done") - Late flag (Tasks)
If(And(Status!="Done", Due < Today()), "⚠️ Late", "") - At-risk (Projects)
If(Or([Project completion %] < 0.5 AND Today() > thisRow.Start + (thisRow.End-thisRow.Start)/2, [Late tasks count] > 3), "At risk", "OK")
Formulas keep your dashboards honest.
Step 8 — Dashboards & reports
Create a Portfolio section with:
- KPIs at a glance
- Projects In progress / Done / At risk
- Average cycle time (End – Start) for Done projects
- On-time completion % (Done before End date)
- Charts
- Projects by Status (bar)
- Tasks due this week by Assignee (stacked bar)
- Completion % by Tag (which themes lag)
- Filters
Controls for Tag, Owner, and Timeframe that bind to view filters (e.g.,Projects.Filter(Tags.Contains(TagControl) OR TagControl.IsBlank())). - Narrative
A canvas block where the ops lead adds a 3-bullet commentary (“What moved,” “Risks,” “Asks”). Stakeholders skim charts, then read your take.
Step 9 — Governance, permissions, and hygiene
- Section permissions: Most pages can be open; lock “Admin” sections with sensitive automations or tokens.
- Row-level privacy: If you need it (e.g., HR items), keep a separate doc for private data; Coda is doc-level secure.
- Naming: Prefix projects with client or product (“ACME – Site revamp – Q4”). Consistent names power better search.
- Review rhythm: Add a monthly “Doc Day” to prune pages, archive old projects, and reset templates.
- Versioning: Clone the doc for major changes or keep a “Sandbox” section to test new automations and buttons.
Step 10 — Common pitfalls (and easy fixes)
- Too many tables. Start with Projects and Tasks. Add SOPs when ready. Fewer tables → fewer links to maintain.
- Copying views instead of filtering. Always create a view of the original table. Duplicated base tables lead to drift.
- Notification spam. Consolidate automations into a morning digest and a weekly summary; keep DMs for overdue or at-risk only.
- Buttons without context. Pair every button with a small note (“Creates 3 starter tasks, due next week”).
- Monolithic pages. Break long pages into sections; use the left navigation and page icons to signal purpose.
14-day rollout plan
Days 1–2: Create the doc structure (Home, My Work, Portfolio, SOPs, Reports). Build People, Projects, Tasks. Add basic views (My Tasks, Portfolio Board).
Days 3–4: Write the Project Brief template (canvas column) and the SOP template. Add 3 real SOPs and 3 active projects.
Days 5–6: Add buttons (New project, Slack summary) and one automation (overdue nudge). Pilot with a small team.
Days 7–8: Install Slack and Calendar Packs. Wire the weekly digest and kickoff calendar events.
Days 9–10: Add workload view and capacity numbers. Tweak filters and conditional formatting.
Days 11–12: Build the Portfolio dashboard (KPIs, charts, commentary).
Days 13–14: Clean up names, write a one-page “How we use this doc,” train the team (20-minute demo). Turn on SOP review reminders.
Final thoughts
Coda shines when you combine one set of canonical tables with multiple role-based views, add a handful of buttons for repeatable actions, and let automations handle the reminders. Start small: Projects + Tasks and a weekly Slack digest already clear most operational fog. Then layer SOPs, workload, and Packs as your rhythm stabilizes. Within two weeks, your “document” becomes a Team OS—a place that not only describes how you work, but actually runs the work.